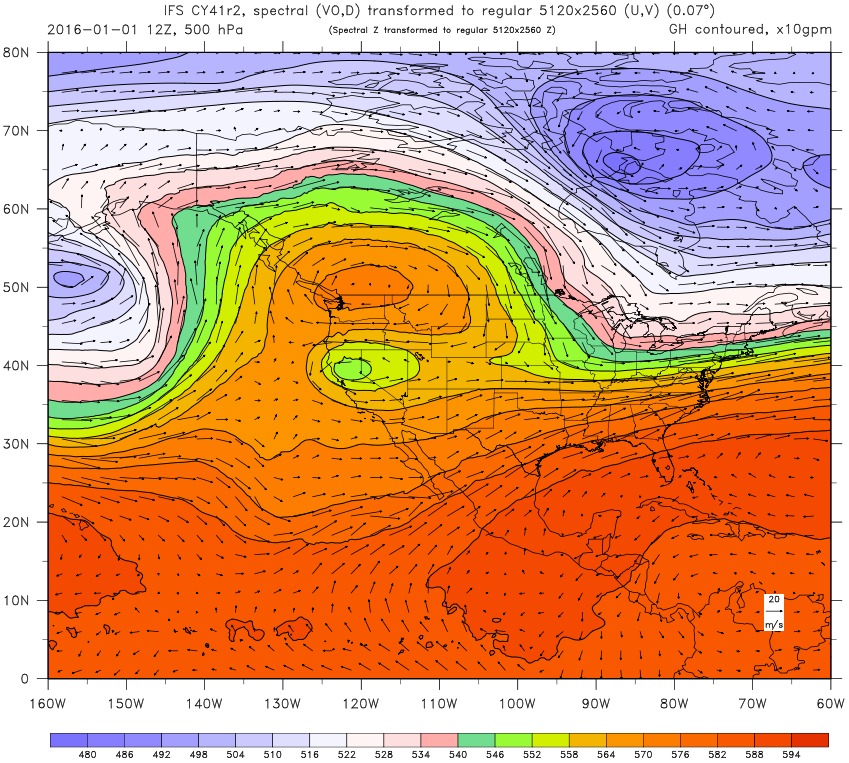
2016-01-01 12:00:00 UTC ECMWF Operational IFS CY41r2 5120x2560 (N1280, T1279, 7.8 km, 0.07°) 500 mb vector U and V winds (in m s-1) computed from spectral vorticity and divergence. Corresponding geopotential height (x10 gpm) computed from spectral geopotential. Cylindrical equidistant projection.
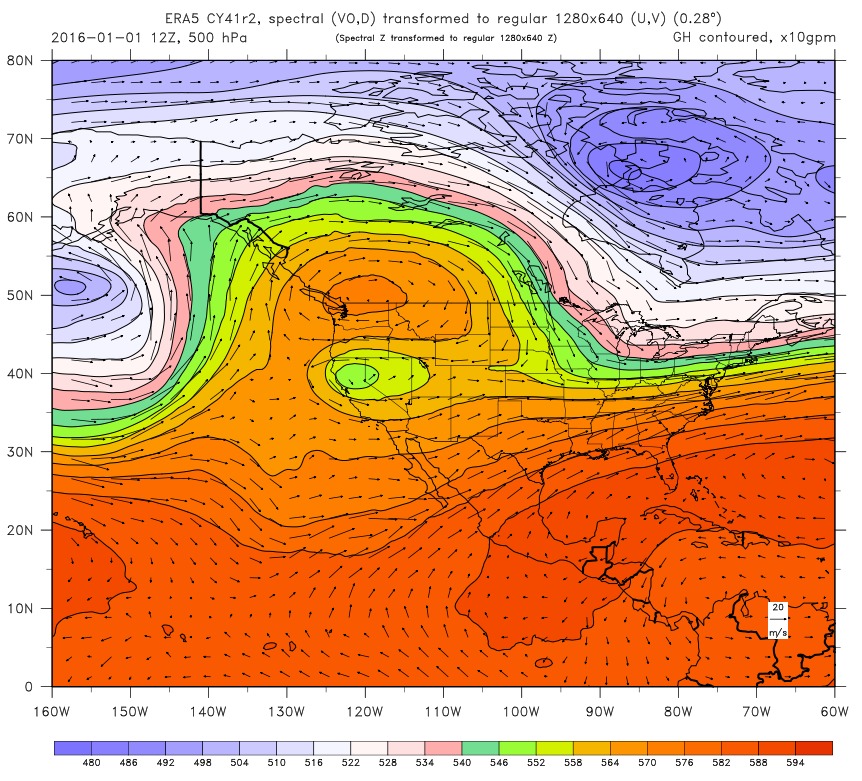
2016-01-01 12:00:00 UTC ECMWF ERA5 IFS CY41r2 1280x640 (N320, T639, 31 km, 0.28°) 500 mb vector U and V winds (in m s-1) computed from spectral vorticity and divergence. Corresponding geopotential height (x10 gpm) computed from spectral geopotential. Cylindrical equidistant projection.
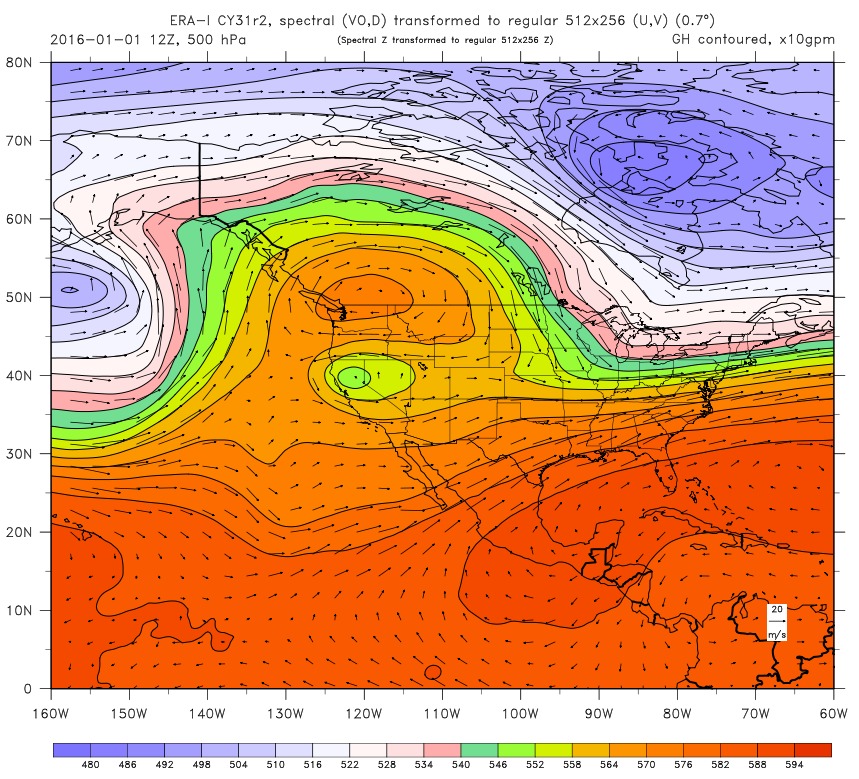
2016-01-01 12:00:00 UTC ECMWF ERA-Interim IFS CY31r2 512x256 (N128, T259, 78 km, 0.7°) 500 mb vector U and V winds (in m s-1) computed from spectral vorticity and divergence. Corresponding geopotential height (x10 gpm) computed from spectral geopotential. Cylindrical equidistant projection.
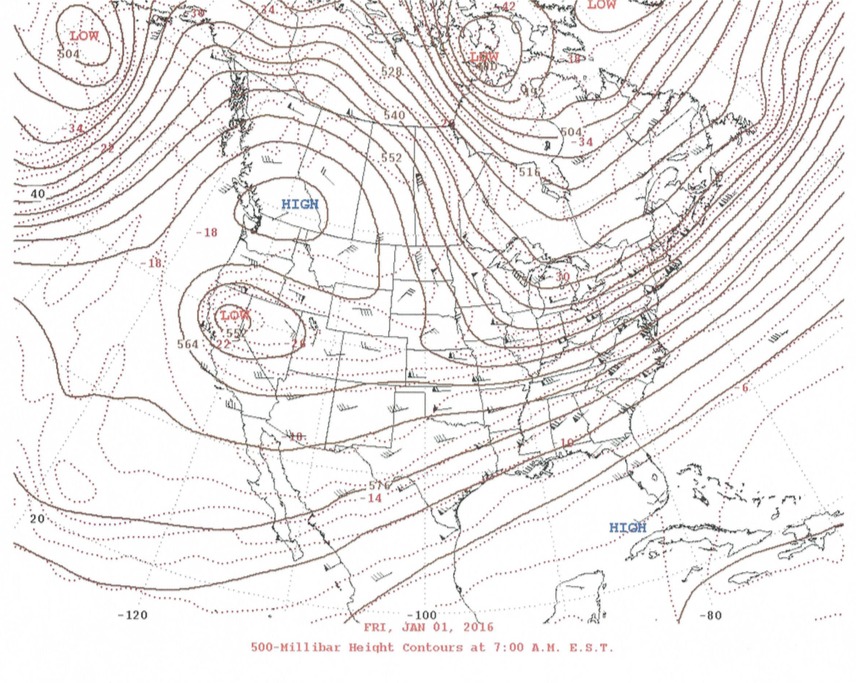
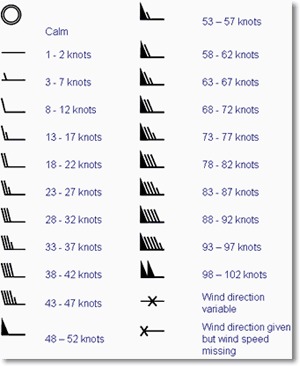
2016-01-01 12:00:00 UTC NOAA Daily Weather Map (produced with GFS-GDAS/FNL) 1440x720 (27.7 km, 0.25°) 500 mb vector U and V winds (wind barbs indicate knots) with corresponding geopotential height (x10 gpm). Lambert conformal projection.
1 m s-1 = 2.23694 mi hr-1 = 1.94384 knots.